Develop viable operating models to realize LTE potential
To meet the exponential growth of data traffic in the mobile communications market, operators are turning to LTE technology while maintaining relatively stable network costs. Because LTE puts the wireless network intelligent management function in eNodeB, traditional monitoring tools no longer have access and monitoring capabilities. In view of this, in order to meet this challenge, a new generation of mobile communication technology and performance monitoring solutions came into being. 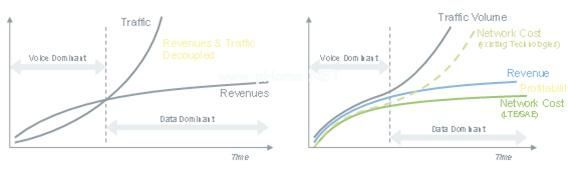
Figure 1: Data business model-economic model
[Left picture content:]
Voice Dominant: Voice business dominant
Traffic: data traffic
Revenues & Traffic Decoupled: Relationship between revenue and data traffic
Revenues: earnings
Data Dominant: Data business dominant
TIme: time
[Illustrated content on the right:]
Traffic Volume: data traffic
Voice Dominant: Voice business dominant
Netwokr Cost (exisTIng Technologies): Network cost (existing technology)
Revenue: earnings
Portability: business migration
Network Cost (LTE / SAE): Network Cost (LTE / SAE)
Data Dominant: Data business dominant
TIme: time
LTE efficiency challenges the introduction of the Apple iPhone and similar devices, resulting in a substantial increase in mobile data traffic. In the coverage area of ​​the first batch of HSPA, the mobile broadband business traffic quickly surpassed the voice business, of which more than 50% of the traffic is related to the use of the iPhone. In most countries, due to fierce competition, many operators are forced to provide flat rate mobile broadband packages. As a result, despite the soaring demand for mobile broadband, the average revenue per user (ARPU) remains unchanged. The traffic generated by an iPhone or a smartphone similar to the iPhone is equivalent to the traffic generated by 30 voice / SMS phones, and the traffic generated by a laptop wireless network card is equivalent to that generated by 450 voice / SMS phones Traffic. Therefore, it is expected that by 2013, mobile broadband services will account for more than 80% of all mobile services. In order to survive in this new environment, operators must reduce or keep their operating expenses (OPEX) unchanged, while at the same time they need to be able to provide significantly increased business traffic.
In order to establish a business model to reduce the impact of business traffic on network costs, operators are rapidly upgrading their networks to efficient all-IP packet switched matrices. Just a year ago, 4G was mentioned as a competition between four technologies, namely LTE, WiMAX, UMA and UMB. As the haunting 4G technology smoke was gradually clarified, LTE technology finally won. UMA and WiMAX will still exist as small-scale technologies, while UMB technology was abandoned by Qualcomm in November 2008. With the clear evolution path of technologies based on 3GPP and CDMA, LTE will provide a common 4G technology and, in the foreseeable future, realize a unique and mutually compatible global communications architecture.
Communication revolution LTE technology has introduced significant changes in its radio access network and core network on the basis of ensuring coexistence with existing 3GPP and CDMA networks. The early 2.5G and 3G radio access networks are now supplemented by Evolved UTRAN (E-UTRAN). 2.5G and 3G base stations will be replaced by new eNodeBs, and the core network will be replaced by EPC. This network architecture and E-UTRAN and other access networks are collectively referred to as System Architecture Evolution (SAE). SAE provides two new functional units: a mobile management entity (MME) node, which is responsible for signaling control; and an SAE gateway, which is responsible for handling the user plane.
Robust access technology
Figure 2: Sharing the signal into multiple subcarriers improves the signal's robustness 
Transmitter: Transmitter
Receiver: Receiver
Interference: Interference LTE uses an all-IP network, abandoning the traditional ATM connection. The eNodeB crosses the radio network controller (RNC) and adopts the method of directly connecting with the MME and SGW. Orthogonal frequency division multiplexing (OFDM) radio access technology is used for the downlink and single carrier frequency division multiple access (SC-FDMA) technology is used for the uplink. The main advantage of adopting OFDM technology based on single carrier is that it can cope with various complicated channel conditions. It can implement adaptive assignment of users to subcarriers based on feedback information related to channel conditions. In this way, even if a small percentage of data loss occurs in the signal after refinement, it will not negatively affect the reception and perception of the signal.
Multiple input multiple output (MIMO) antenna technology is applied to both uplink and downlink. By implanting multiple transmitters and receivers into the antenna, the transmitter and receiver can use a series of subcarriers to transmit signals, thereby ensuring that they are not affected when interference occurs. The LTE modulation and demodulation scheme – 64-QAM / 16-QAM / QPSK – guarantees the stability of the signal strength as the distance increases. The dynamic bandwidth allocation technology monitors the network in real time. When the user interferes or receives other excessive signals, the base station allocates more bandwidth and power to the interfered data stream.
All-IP service Voice communication in LTE is implemented using Voice over IP (VoIP), which requires a delay of less than 150 milliseconds (ms). LTE only introduces very low latency of less than 10ms in the wireless side interaction, thus meeting this requirement. On the wired side, whether it is a VoIP called entity, a network server, or an IPTV server, etc., the end-to-end delay between the user and the device is an order of magnitude higher, which is close to 100 ms.
Figure 3: Meta-layer diagnostic diagram 
SON DiagnosTIcs: SON diagnosis
Saving operating costs In terms of operations and efficiency, LTE has taken communication networks to a whole new level. Many major operational tasks are completed automatically, such as configuration, optimization, and problem identification, to minimize related operating costs. These autonomous automated processes are controlled by secondary entity devices such as MME and Operations and Management Center (OMC), which control and manage local actions that occur within a certain network segment or the entire network. The traditional diagnosis function will be transplanted into the meta-layer diagnosis method, which includes:
Self-configuration: The central configuration server automatically associates the new network element with the network. Setting operational and security parameters for protocol extensions such as DHCP and NETCONF requires little or no human intervention.
Self-optimization: Repetitive optimization tasks, such as neighbor cell list optimization, coverage and capacity optimization, mobile robustness optimization and mobile load balancing optimization, are all completed within the first layer of eNodeB using powerful independent intellectual property algorithms.
Automatic problem identification and self-repair: Using a set of strictly defined rules and carefully selected KPIs, common problems are automatically identified and handled at the first-level response layer. When the whole cell is interrupted, it can be compensated using the predefined neighboring cell management strategy.
Demand for an efficient operating model Although there is global agreement to use LTE as the only technology leading to 4G, and it brings huge opportunities in terms of network deployment speed and funding, a viable LTE operating model is still being explored. In particular, LTE operation and maintenance requirements have brought major challenges to the monitoring system. First, it needs to be able to monitor large amounts of data. A user equipment (UE) terminal can support up to 100 Mbits / s, and a cell can support a maximum data rate of 330 Mbits / s. This makes the 10 Gbits / s wired interface a standard interface.
Second, abandoning RNC means that there will be no more measurement reports on the interface between RNC and eNodeB. This interface has been used to capture important data before, such as how much bandwidth each connection consumes and retransmission control. An alternative solution is to access the air interface, but this method requires complicated and expensive spectrum analysis tools. Fortunately, network equipment manufacturers have begun to provide standard trace or log ports to access hidden processes within eNodeB.
The third challenge facing the monitoring system stems from the elimination of circuit switching in LTE to achieve an all-IP network. The protected 64kByte channel will disappear. Various services with very different behavior characteristics will be transmitted in real time using the same transmission architecture, so it is particularly important to deploy efficient QoS monitoring tools first. A number of operators are promoting the implementation of the LTE plug-in standard (VoLGA-LTE voice over universal access bearer), with a view to continuing to use circuit-switched services on the LTE access network, which is enough to illustrate this challenge. Even if this standard is successfully implemented, since most of the services in LTE are XoIP, the importance of user plane diagnosis in 4G will be greatly improved than before.
Automatic self-optimizing network (SON) function is a key element in 4G network operation. They provide network monitoring, data collection and analysis, and well-designed debugging, verification, and certification procedures to ensure SON operation. The automation function can greatly reduce the maintenance workload required in the long term. But they are only effective 90% of the time, so these functions must be monitored and diagnosed. In addition, SON is composed of expert systems based on certain rules, which must be verified in conformance testing and acceptance testing. 
Figure 4: LTE RAN test strategy data collection time Remarks RAN server Tracking port RAN agent Uu probe Dol (%)
24/7/365 ï® Only S1 CP and X2 X 10
24/7/365 ï® Based on Uu, X2 and S1 CP correlation for permanent monitoring and KPI calculation X X 50
Periodically "debug on demand" ï® Monitor eNodeB subsets on demand, debug and analyze root causes RAN server / OSS, configure on-demand retrieval operations based on click topology models
Tactical "scene-based debugging" ï® Select a small number of related eNodeBs
ï® Use Uu probe to monitor based on the scene ï® Monitor Uu, X2 S1CP and S1UP
Developing monitoring and testing strategies Figure 4 illustrates the analysis of various radio access network (RAN) diagnostic strategies, we can see the conflict between the cost and time of data collection and the depth of insight (DOI). The RAN with passive probes sniffs the control plane passively and captures the signaling messages forwarded on the S1 and X2 interfaces. This method is low in cost and convenient, and can be operated 365 days a year, 7 days a week, and 24 hours a day. However, as shown in the right column, the DOI it provides is about 10% of the most complete method.
The RAN proxy method provides additional DOI in two operating modes. In low load mode, data tracking, logs and counters are extracted from the dedicated eNodeB tracking port. Generally, it also includes data related to the air interface operation from the Uu interface. The information is then processed by the RAN agent and sent back to the central monitoring system through the S1 backhaul in the form of KPIs and counters, which can then be correlated with the information collected by the probe system on the S1, CP and X2 interfaces. Other data provided on the tracking interface can increase the DOI up to 50%. The diagnostic capabilities provided by this method depend on the function and performance of the tracking port, which varies greatly between manufacturers.
In high load mode, the RAN agent provides complete call tracking and packet decoding functions as well as KPIs and counters. The amount of data that needs to be transmitted backhaul is significantly larger than the low-load mode. Because of this, this method is usually used as part of the operation and maintenance activities, rather than being used 24 hours a day, seven days a week. During testing, commissioning or optimization activities, experts usually visit the site and run the system. When the data needs to be associated with other remote interfaces, experts will manually transfer the data back to the central monitoring system. It is also possible to run RAN agents in high-load mode remotely to schedule uploading large amounts of test data during off-peak hours. The DOI of the high-load RAN proxy method can be as high as 80%.
When the above method cannot provide enough information to solve the problem, you can connect the Uu probe to the public public radio interface (CPRI). The Uu probe can monitor the physical layer and higher layers of the Uu interface, and can correlate these data with the data of other interfaces. In addition, the air interface information collected on the CPRI interface is completely independent of the air interface information provided on the eNodeB tracking port. The latter is information that has been processed based on the eNodeB's own baseband.
Top-down and bottom-up methods There are two basic methods for debugging an LTE network. The top-down approach refers to starting with the application layer and examining various performance indicators, such as voice quality or page load time. For example, if there is a problem with voice quality, each transaction will be identified and classified and correlated with the message in each transaction. The debugging tool filters events based on IMSI / IMEI and other indicators, and directly accesses message details.
The bottom-up approach requires looking at the problems of each frame, such as packet loss or frame offset, and then looking up at which connections they belong to. The debugging tool provides the distribution of each protocol message, a graphical window of statistical data and a digital window. It displays events graphically according to time, directly enters the message details and drills up from a single message to the entire call flow. 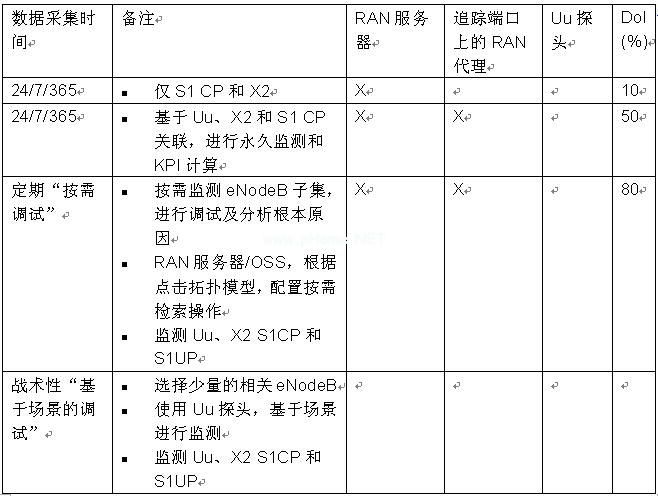
Figure 5: LTE diagnostic architecture
[Illustrated content:]
Tektronix LTE Test System: Tektronix LTE Test System
Tektronix Ethernet Probes: Tektronix Ethernet Probes
Tektronix High Speed ​​IP Probe: Tektronix High Speed ​​IP Probe
Tektronix Air Interface Probe: Tektronix air interface probe test structure layout Figure 5 summarizes our proposed passive monitoring test system architecture. The basic idea is to surround three key network elements, namely: eNodeB, MME and SGW, while covering each of its peripheral interfaces.
In order to determine the eNodeB operation, access to the first and second layer radio interface information is essential. The key to cost-effective testing is to be able to provide information in real time, and express this information with clear and accurate graphics, allowing users to immediately identify whether the observed behavior meets the required performance indicators. Vendors are increasingly using CPRI to replace expensive RF connections between antennas and base stations. Through the CPRI port on the eNodeB, it can support multi-level physical layer analysis and allow users to fully understand the operation of the RF layer.
Collecting data from key air interfaces through the CPRI port allows operators to dig deep into the physical layer of the eUTRAN network. RF parameter measurement provides physical layer analysis functions, such as input power and receive bandwidth, clock and time offset, and frequency offset. Through the measurement of input power, receiving bandwidth and clock, time and frequency offset and other parameters, RF connection analysis can be carried out. By using graphical views such as time and frequency domain signaling, resource modules, OFDM symbol and subcarrier usage, etc., resource usage can be verified. Of course, the channel quality and error control can also be investigated by using CQI, HARQ, BER, and CRC measurement and analysis functions.
Upward analysis of the next layer of the OSI model-the MAC layer can only be done through CPRI. The scheduler function ensures that the eNodeB allocates corresponding frequency and time resources to users based on available cell capacity, wireless conditions and required quality of service, which is essential to ensure the normal operation of the network. Monitoring the performance of the scheduler can provide key information to determine how the scheduling algorithm can be modified to provide better service performance.
Combining S1 and X2 interface control and user plane association analysis with Uu analysis on the CPRI link can provide 360 ​​° comprehensive understanding of eNodeB operation. A chart that combines user plane, signaling information, and wireless parameters can help optimization engineers determine the impact of RF issues on the upper-layer user plane data bearing performance. At the same time, the cell-level graph shows how cell performance varies with load and traffic patterns. By correlating data on multiple interfaces, you can easily calculate the delays associated with each network element. When transmitting within the LTE network and when switching between LTE and other technologies, user calls and sessions can be tracked.
Automatically associate user calls and activities on the monitored interface to get an overview of each call and the most important attributes. With the ability to drill down to bit-level details, users can drill down to a subset of calls that they wish to examine metrics. For call trace frames of special interest, user plane quality analysis can be derived and further performed.
Through the application of the statistical distribution scanning function for a large amount of data, users can quickly identify those sudden or unusually high frequency messages or abnormal release reasons captured on the monitored LTE interface. By observing the distribution of this event at different times, users can quickly see whether the problem is related to an event (such as a network node restart) or is evenly distributed throughout the test cycle. By "drilling down" from various messages and events to related call tracking, users can quickly investigate and analyze the affected time based on their own experience. 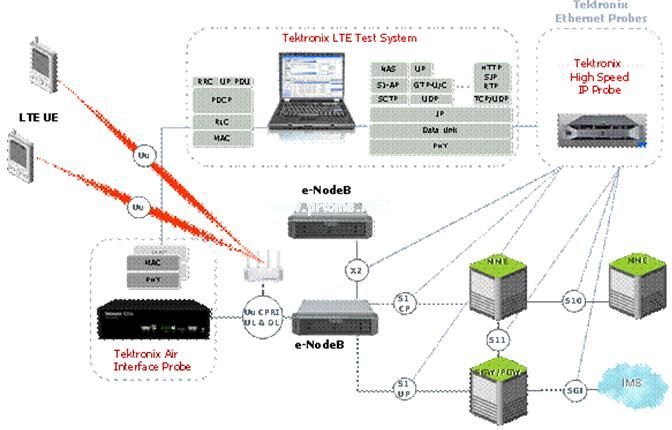
Figure 6: LTE Layer 1 / Layer 2 related wireless information obtained with the Tektronix K2Air LTE air interface monitor. If you want to monitor LTE performance more specifically, you can use KPI to map the complex relationship between multiple parameters and call phases . KPI provides key insights for understanding the interaction between different parameters. With LTE KPI, users can determine the performance of multiple services, such as mobility management (attachment failure, handover, tracking, and location update success / failure), service management (radio bearer analysis, throughput analysis), and wireless performance (connection establishment Time, number of retransmissions, resource allocation). The KPI identifies problem areas, and then effectively maps the relationship between business problems and network problems.
Prospects In theory, LTE has all the functions we need to enter 4G, but we still have a long way to go before we can make it work. The shift to LTE is similar to our shift from fixed-line narrowband ISDN transmission to DSL-based broadband Internet access ten years ago. The main change facing operators is the development of an operating model that for the first time provides IP-level efficiency in mobile communication networks. Complex automatic functions, huge encrypted user plane services, complex QoS and QoE conventions based on countless combinations of services, complex OFDM / MIMO wireless interfaces, etc. must all be dealt with. Problems will continue to be discovered, and new methods will also be developed to solve these problems. Only in this way can the huge potential advantages of 4G be realized.
1. fashion led light,dazzling diamond crystal
4. easy setting, shock resistance and dust-proof
Modern LED table lamps are a pleasing addition to any family room or kids bedroom. Due to its low energy consumption,
a LED Table Lamp generates virtually no heat making it cool to the touch and greatly reducing the potential risk of getting burnt or starting a fire.
Aluminum Material LED Desk Lamp
Aluminum Material LED Desk Lamp,Aluminum Material Office LED Desk Lamp,Aluminum Material Modern LED Desk Lamp,Aluminum LED Bulb
Shenzhen Superlight Technology Co., Ltd. , https://www.superlighttech.com